


TRADING GOLD AND SILVER HAVE A LONG HISTORY
There are three major gold trading centers in the current global market, namely London, New York & Shanghai. London has the most extended history being the hub for “OTC Loco London” 1 trade. New York is home to COMEX with highly liquid gold futures, traded around the clock with global access and physically delivered in New York. Investors in Asia have historically preferred to own physical gold in the form of bullion bars and jewelery. However, with China’s economic development at the turn of the century, the trading of paper gold gained popularity rapidly. The Shanghai Gold Exchange (SGE) and Shanghai Futures Exchange (SHFE) account for the highest volumes of spot gold and gold futures trading, respectively, among the Asian exchanges. The three regional trading centers interact with and complement each other, with arbitrage trading constantly going on. This paper discusses the features of trading gold and silver products across various markets and explains the arbitrage opportunities that are potentially appealing to investors in Asia.
TRADING GOLD AND SILVER AND BREAKING DOWN BULLION SALES TAX IN NEW YORK
According to the law, trading gold and silver is taxable in New York with min 4% and a max of8.875% bullion sales tax. However, trading gold and silver comes with an exemption from the taxation if the purchase transaction is equal to or more than $1,000. The bullion refers to coins, bars, and ingots purchased for investment purposes. However, if the dealer is not registered with the New York Department of State, the exemption, in that case, does not apply. and does not apply to the coins produced by the Republic of South Africa. Further adding, bullion price should not cross 120% (gold tax applies on gold less than ¼ oz), 140% silver and 155% other valuable metals prices should be exact to qualify exemption. Trading gold and silver bullion products, medallions, and numismatic coins that do not surpass the exemption are taxes.
COMEX GC Gold is Very Liquid During Asian Hours
It is well known that COMEX has the highest traded volumes of Gold futures (code: GC) among all the global exchanges, at over 381,000 contracts2 (or 1,185,000 kilograms) a day. The gold market trades around the clock, and CME Group offers trading virtually 24 hours per day, enabling the world to access the market at times that work best for their schedules, whether in Asia, Europe, Latin America, or the United States. As a global product, GC offers great liquidity throughout the day. The volume of GC traded during Asia trading hours alone (which we have defined here as 8 a.m. – 8 p.m. Singapore time)3 is over 390,000 kilograms a day.
Figure 1: GC volumes very liquid during Asia hours

Figure 2: Breakdown of GC volumes by trading hour

Figure 1 shows that COMEX gold volumes, during Asian hours alone, are greater than the total volumes of the individual peers in Asia. The average monthly gold futures volume at COMEX (during Asia hours, from January
2017 to April 2018) was about 6.4 million kg 1.6 million kg at SHFE4, 2.2 million kg at SGE, and 0.6 million kg at TOCOM. Growth in our Asian hour liquidity has been significant, e.g., Asia hours currently account for over 33%5 of total GC versus 15 % in 2012.
Cross-Exchange Trading of Gold Futures
In Asia, several new exchange-listed gold products have been introduced to the market in recent years. For example, Hong Kong Exchange has made another attempt to launch gold futures in July 2017; and DGCX recently launched a contract based on SGE’s gold benchmark. So far, the gold futures contracts which have attracted decent volumes are on SHFE in China and TOCOM in Japan.
Correlation is an important tool for traders engaged in cross-market trading. Gold prices are closely correlated across regional exchanges, attracting many traders seeking to arbitrage gold trades across different exchanges. The fact that COMEX gold futures are highly liquid during Asia hours has made arbitrage trading between gold futures listed on COMEX, SHFE, and TOCOM especially popular in the region.
Comparing COMEX, SHFE and TOCOM Gold Futures
As the contract size of GC is 100 troy ounces (roughly 3.11 kg), traders who arbitrage GC futures against either SHFE or TOCOM gold futures (both 1-kilogram contracts) would trade three SHFE/TOCOM contracts for every GC contract. The relevant features of the contract are listed in figure.3
Figure 3: Contract Specifications of COMEX, SHFE and TOCOM Standard Gold Future Contracts
| COMEX | SHFE | TOCOM | |
| EXCHANGE SYMBOL | GC | AU | 11 |
| BLOOMBERG SYMBOL | GCA Comdty | AUAA Comdty | JGA Comdty |
| CONTRACT UNIT | 100 troy ounces6 | 1 kilogram | 1 kilogram |
| PRICE QUOTE | USD per troy ounce | CNY per gram | JPY per gram |
| TICK SIZE | $0.10 | CNY 0.05 | JPY 1 |
| AVERAGE PRICE IN 2017 | $1,300/oz | CNY 280/gram | JPY 4,500/gram |
| CONTRACT VALUE | ≈ $130,000 | ≈ $40,000 | ≈ $40,000 |
| QUALITY STANDARD | Minimum 99.5% fineness | Minimum 99.99% fineness | Minimum 99.99% fineness |
| TRADING HOURS | Sun – Fri (Chicago time) 18:00 – 17:00 (+1) | Mon – Fri (Beijing time) 09:00 – 11:30, 13:30 – 15:00, 21:00 – 02:30 (+1) | Mon – Fri (Tokyo time) 08:45 – 15:15, 16:30 – 05:30 (+1) |
| DAILY SETTLEMENT TIME | 13:30 (New York time) (17:30 / 18:30 GMT) | 15:00 (Beijing time) (07:00 GMT) | 15:15 (Tokyo time) (06:15 GMT) |
| LISTED CONTRACTS | Even months and 3 nearest months | Even months and 3 nearest months | Even months |
| LISTING DURATION | Listed out to 6 years | 12 months listed | 6 even months listed |
| SETTLEMENT METHOD | Physical | Physical | Physical |
| TERMINATION OF TRADING | 3rd last business day of contract month | 15th day of contract month | 3rd last business day of contract month |
Source: CME Group, SHFE, TOCOM
In addition to the standard size GC contract, more minor-sized futures contracts (the 50 troy ounces E-mini Gold, 10 troy ounce E-micro Gold, and 1 kilogram Gold Kilo) are also listed on COMEX. Although their contract sizes are closer to that of SHFE’s and TOCOM’s contracts, they are usually traded by institutions that have specific requirements. The flagship 100 troy ounce GC contract is the prevailing choice for price discovery amongst institutional and retail investors.
GC is the primary choice by market, while other smaller contracts also enjoy growth
In addition to the standard size GC contract, smaller-sized futures contracts (the 50 troy ounce E-mini Gold, 10 troy ounce E-micro Gold, and 1 kilogram Gold Kilo) are also listed on COMEX. Although their contract sizes are closer to that of SHFE’s and TOCOM’s contracts, they are usually traded by institutions with specific requirements. The flagship 100 troy ounce GC contract is the prevailing choice for price discovery amongst institutional and retail investors.
Figure 4: Other Gold futures contracts listed on COMEX
| E-mini Gold | E-micro Gold | Gold Kilo | |
| EXCHANGE SYMBOL | QO | MGC | GCK |
| CONTRACT UNIT | 50 troy ounces | 10 troy ounces | 1 kilogram |
| CONTRACT VALUE | ≈ $60,000 | ≈ $12,000 | ≈ $40,000 |
Source: CME Group
Correlation is Good Between COMEX, SHFE and TOCOM Gold Futures
Gold is the same precious metal throughout the world, and gold prices in different countries have historically stayed closely correlated over time, hence its attraction as an arbitrage instrument. The price movements of COMEX, SHFE, and TOCOM gold futures during the past 16 months were compared, accounting for foreign currency translations, in Figure 5. Their front or spot month contracts (which are proxies to spot gold prices in the respective regions) have exhibited price level correlations in excess of 0.8 for most of that period.
Local geo-political events or demand-supply imbalance have resulted in price divergences over the short term, such as observed between COMEX and SHFE gold prices in recent months.7 This is likely to attract investors to take spread trade positions, especially between these two contracts.
Figure 5: Correlations between Gold prices are historically in excess of 0.80 8
| PRICE CORRELATION (FRONT MONTHS) | COMEX VS SHFE | COMEX VS TOCOM |
|---|---|---|
| Jan – Jun 2017 | 0.96 | 0.98 |
| Jul – Dec 2017 | 0.94 | 0.97 |
| Jan – Apr 2018 | 0.81 | 0.85 |
Gold Futures (Front Month)

Trading the Active Contract Months
Thus far, the investment case for COMEX gold futures, and the attractiveness of arbitrage trading between COMEX, SHFE, and TOCOM, have been laid out. However, there are some intricacies that a trader needs to be aware of to optimize his trading experience. The first is knowing which contract months to trade during different. Retail investors would trade the most liquid contracts, as these contracts have the tightest bid-offer spreads and the more profound order book.
Figure 6: Liquidity of various contract months over time (higher volumes are in darker shades)
")
")
")
Each of the three gold contracts appears to have distinctive characteristics. COMEX’s gold volumes seem to cluster around the second forward month contract; for example, the most liquid contract in January and February is the April contract.
SHFE’s volumes seem to cluster around two contract months; trading volumes from May to October are concentrated in the December contract and the June contract from November to April. TOCOM’s volumes are clustered around the furthest contract month.
In Figure 7, the most liquid months for each exchange were paired, and their respective price correlations compared 9. Before October 2017, the price correlations between COMEX GC, and the liquid gold contracts at SHFE and TOCOM, have been well-behaved at over 0.90. However, while the seasonable breakdown in correlations from November to December 2017 is typically ascribed to traders going off for their vacations, price correlations since February 2018 have generally tracked lower at 0.80 or less. This suggests that, while GC volumes during Asia trading hours have increased, gold arbitrage trading between COMEX, SHFE, and TOCOM is also becoming more intricate
Figure 7: Correlations between the paired contract months over time 10
| CALENDAR MONTH
ACTIVE CONTRACT |
06-17 | 07-17 | 08-17 | 09-17 | 10-17 | 11-17 | 12-17 | 01-18 | 02-18 | 03-18 | 04-18 | 05-18 | 06-18 | 07-18 |
|---|---|---|---|---|---|---|---|---|---|---|---|---|---|---|
| COMEX | Aug-17 | Dec-17 | Feb-18 | Apr-18 | Jun-18 | Aug-18 | ||||||||
| SHFE | Dec-17 | Jun-18 | Dec-18 | |||||||||||
| TOCOM | Apr-18 | Jun-18 | Aug-18 | Oct-18 | Dec-18 | Feb-19 | Apr-19 | Jun-19 | ||||||
Figure 7: Gold Price Correlation (Liquid Months)
")
Arbitrage Opportunity in Back Months
There is typically around a $30/oz price differential between the spot month prices of COMEX and SHFE/TOCOM. This is usually explained away as the logistics and transportation costs to bring the metal into the Far East. Nevertheless, the sporadic widening of spreads may provide short-term arbitrage opportunities for investors who are alert to them.
Figure 8: How the shapes of Gold forward curves change over time
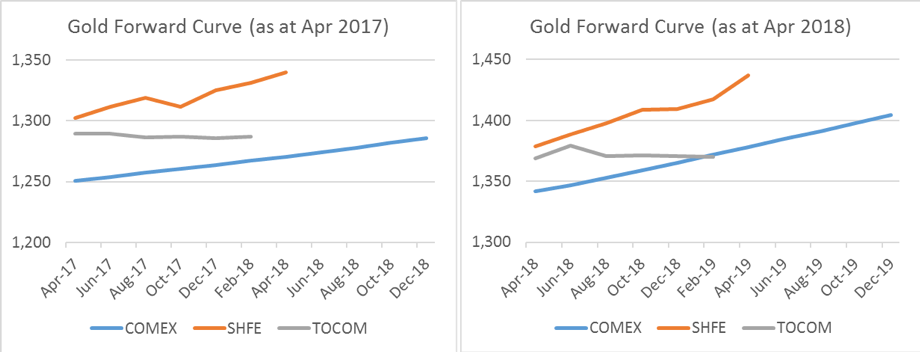
As Figure 8 shows, like COMEX’s forward curve, SHFE’s gold forward curve is contango in shape, but it does exhibit some kinks along the curve, possibly due to localized factors.
The liquid contracts also tend to be concentrated in the June and December contract months.
TOCOM’s forward curve is unusual in that it tends to be in slight backwardation! This is possibly because volumes and open interests tend to converge on the furthest listed contract month, 10 to 11 months forward. As such, the forward price tends to converge toward the COMEX forward price, while the spot month price tends to converge toward the SHFE spot month price.
Other Gold Trading Strategies
In precious metals trading, institutions regularly engage in other, more complex, trades in a bid to outperform the market. Most of them are not as popular amongst retail investors, and are briefly mentioned here for knowledge.
- Trading gold ETFs (exchange-traded funds) against COMEX gold futures. Gold ETFs, such as the SPDR Gold, are also popular investments, but there are differences between an ETF and a futures contract. Besides different tax treatments and fees, an ETF tracks the spot price of gold and tends to be invested as a buy-and-hold strategy. In comparison, gold futures are used as a hedging tool with a view on the forward price of gold. There may be specific reasons an investor might arbitrage a gold ETF against gold futures. Still, retail investors can usually achieve similar results by trading GC’s different, forward-month contracts.
- Gold-Silver Trading Arbitrage. Traders who arbitrage the two precious metals closely monitor the Gold-Silver trading ratio. The ratio represents the number of ounces of silver to buy one ounce of gold. When gold trades at $1,300 per ounce and silver at $16 per ounce, the ratio is 81. This is an interesting trading strategy and is elaborated in a separate paper.
- Loco London Spot against COMEX gold futures. The Loco London T+2 Spot Gold/Silver versus COMEX (known as an EFP, Exchange for Physical) arbitrage is the means to hedge OTC positions (long or short) in a transparent, liquid, and cost-efficient environment. Typically, the T+2 OTC leg will be rolled on a tomorrow/next (T/N) basis, therefore, negating delivery if short or financing if long. Traders universally use this practice from banks, trading companies, and even buy-side to manage their risks 24 hours a day. The new Spot Spreads products launched on COMEX offer spontaneous hedging on the spread risk between futures and OTC positions for the market participants.
- COMEX and SGE arbitrage is another such example. The trading mechanics are less straightforward than with SHFE because SGE is a physical exchange. The arbitrage trade between COMEX and SGE is similar to COMEX versus Loco London and is more likely made by bullion banks that have licenses to import gold into China.
- SHFE versus SGE. Within the Chinese border, there is active arbitrage between SHFE gold futures and SGE spot gold by the Chinese investors. This is usually not available to non-domestic investors.
COMEX and SHFE Silver Futures
Silver is often overshadowed by Gold, be it for Spot, ETF, or futures trading. Still, it should be noted that COMEX Silver futures attract an average daily trading volume (ADV) of over 102,000 contracts (versus COMEX Gold futures’ 381,000 contracts) and are the second-highest traded precious metal by contract volume on CME Group. The COMEX Gold vs. COMEX Silver spread futures is a trendy commodity spread trade on CME Group.
Although the unit price of silver (around $17 per ounce in Q1 2018) is much lower than that of gold (around $1,300 per ounce in Q1 2018), the value of a COMEX Silver contract is around $85,000, or about two-thirds that of a COMEX Gold contract. Silver futures are also listed in smaller contract sizes on COMEX (2,500 troy ounce E-mini and 1,000 troy ounce E-micro); most of the volumes reside in the standard 5,000 oz contract.
The features of the COMEX Silver contract are in Figure 9, and the monthly volumes and open interest are in Figure 10. In addition, the SHFE Silver contract is included for comparison.
Figure 9: Contract Specifications of COMEX and SHFE Silver
| COMEX | SHFE | |
| EXCHANGE SYMBOL | SI | AG |
| BLOOMBERG SYMBOL | SIA Comdty | SAIA Comdty |
| CONTRACT UNIT | 5,000 troy oz | 15 kilogram |
| PRICE QUOTE | USD per troy ounce | CNY per kilogram |
| TICK SIZE | $0.005 | CNY 1 |
| AVERAGE PRICE IN 2017 | $16.00 | CNY 3900 |
| CONTRACT VALUE | ≈ $80,000 | ≈ $60,000 |
| QUALITY STANDARD | 99.9% fineness | 99.99% fineness |
Source: CME Group, SHFE
Figure 10: Volume & OI of COMEX and SHFE Silver Silver Volume and Open Interest

Silver is more widely used as an industrial material than gold, and general economic conditions influence prices. On the other hand, it also behaves like a currency and, like gold, is influenced by psychological forces and flights to haven.
While prices of both metals gold and silver trading tend to be volatile during key economic releases, such as the FOMC meetings and interest rate decisions, the volatility of Silver has historically been higher than gold, and this is one of the features in its favor amongst precious metals traders. In addition, banks and financial institutions trading gold and silver futures as hedges against political or economic problems, and retail investors often take short positions to ride the trend.
Like gold, investors like to arbitrage between COMEX and SHFE Silver. The trading strategies and mechanics are similar to the gold arbitrage, and as explained earlier, a retail investor would select the most liquid contract for each leg of the spread. Figure 11 shows most liquid trading Gold and Silver futures, on COMEX and SHFE, at different times of the year. The price correlation between trading gold and silver is usually above 0.7. The price correlation between COMEX Silver and SHFE Silver is also provided for comparison.
Figure 11: Correlation between COMEX/SHFE Gold/Silver, and the liquid contracts during each calendar month
| CALENDAR MONTH
ACTIVE CONTRACT |
06-17 | 07-17 | 08-17 | 09-17 | 10-17 | 11-17 | 12-17 | 01-18 | 02-18 | 03-18 | 04-18 | 05-18 | 06-18 | 07-18 |
|---|---|---|---|---|---|---|---|---|---|---|---|---|---|---|
| COMEX Gold | Aug-17 | Dec-17 | Feb-18 | Apr-18 | Jun-18 | Aug-18 | ||||||||
| SHFE Gold | Dec-17 | Jun-18 | Dec-18 | |||||||||||
| COMEX Silver | Sep-17 | Dec-17 | Mar-18 | May-18 | Jul-18 | Sep-18 | ||||||||
| SHFE Silver | Dec-17 | Jun-18 | Dec-18 | |||||||||||
Assets Price Correlation (Front Months)
")
Source: CME Group, SHFE
Conclusion
Retail investors differ from institutional investors in that their trade sizes are typically much smaller. And they differ from proprietary traders in that their investment horizon is relatively longer, typically from intra-day to one month, as opposed to minutes. In addition, retail investors tend to be trend followers, taking a trading position after observing that a broad trend has started.
Given that there are commissions and fees charged by retail brokers and futures commission merchants (FCM), retail investors need to select liquid futures contracts (where bid-offer spreads are tighter) to minimize price slippage. Futures are also more cost-efficient than cash-and-carry trades or over-the-counter investments due to the leverage offered and the margin offsets available when spreading two futures contracts on the same exchange.
Trading in gold and silver outright futures, spread trades between the two, and gold options are among the most popular commodities trades that retail investors participate in. This article has laid out the core fundamentals. An investor should also talk to brokers and FCMs to compare the fees charged so as to optimize investment costs and returns.
References
1. The wholesale over-the-counter London bullion market for the trading of gold and silver, conducted by members of LBMA.
2. 381,000 contracts were the average daily volume for the period from January to March 2018.
3. 8 a.m.– 8 p.m. was chosen to compare trading during and outside U.S. regular trading hours. 390,000 kilograms were the average daily volume during Asia trading hours from January to March 2018.
4. SHFE and SGE report their trading volumes by ‘sides’. To make them comparable to COMEX which report volumes by ‘round turns’, the SHFE/SGE volumes are halved. 1 COMEX GC (100 oz) contract is equivalent to 6 SHFE/SGE (1 kg) gold contracts.
5. 33% was for the period Q1 2018. In April 2018, Asia hours accounted for 38% of total GC volume.
6. As a point of interest, the unit “troy ounce” is equal to 31.1 grams. “Fine troy ounce” is distinct from “troy ounce” in that it describes the weight of pure gold contained in the gold bar. The price of gold in $ per “fine troy ounce” is exactly the same, regardless of whether the gold bar is of 99.5% or 99.99% fineness.
7. The divergence was observed to have started in late October 2016, a period which coincided with the run-up to the U.S. presidential elections. SHFE’s divergence since H1 2017 reflects China’s potential emergence as a distinct price discovery center.
8. Average Price Level correlation of front-month Gold futures for July 2017 – April 2018 is 0.96 for COMEX vs SHFE, and 0.98 for COMEX vs TOCOM. Average Log Return correlation for the corresponding periods are 0.36 and 0.36 respectively.
9. Note that when rolling the liquid months, COMEX GC August contract will roll into the December contract (not the October contract), so there will be a step change in prices during that roll. Likewise, the SHFE liquid contract rolls from June to December, and to June, so there will be a step change in price each time the contract is rolled.
10. Average Price Level correlation of liquid-month Gold futures for July 2017 – April 2018 is 0.99 for COMEX vs SHFE, and 0.99 for COMEX vs TOCOM. Average Log Return correlation for the corresponding periods are 0.35 and 0.36 respectively.
Our Services
